EXECUTIVE SWEET?

Before taking even one step further, I’ll tell you right up front that this is more of a “for fun” discussion than not. For many a moon I have followed a number of sentiment surveys that I believe can be quite helpful. Not investor sentiment, although there are plenty of them, but rather the sentiment of folks who sit on the front lines of actual business operations, and most importantly corporate earnings. I am referring to CEO and CFO surveys.

If I had to pick just one, it would be the Conference Board CEO business confidence survey that unfortunately only hits the tape quarterly. Why? Let’s have a look at the following chart that is the long term history of the CEO Business Confidence survey. For good measure I’ve marked each official US recession since the inception of this survey. Can you see why it’s one of my favorites?

ccceobizconfidence

Although no one in this wonderful world is clairvoyant, inclusive of every central banker on planet Earth despite what you may have heard, the CEO’s having contributed to this survey over time have had an absolutely remarkable record of calling turns in the economy. And wildly enough, almost exactly on the money. Very important for us as investors given that the financial markets also anticipate. You can see looking at the chart that CEO business confidence bottomed in each US recessionary period prior to the end of the official recession itself – exactly as equities usually bottom and begin to rally prior to the economic bottom in each recession.

The experience in 2001 was a bit different, but you may remember years later that recession (although still “on the books”) was essentially revised away as there were no two down GDP quarters officially. Secondly the 2008-2009 experience was also a bit different. Although CEO confidence bottomed before 2009 even began, downside anticipation was a bit less than in prior cycles. Personally I attribute this to the fact that a credit cycle implosion dragged the economy down with it, not the other way around as is usually the case in “normal” economic cycles. Nonetheless, CEO confidence bottomed well before equities in that 2008-2009 cycle. Had we “listened” to the CEO’s, we would have known the 2009 equity bottom was a buy.

What’s one lesson here? Moves below 40 on the CEO business confidence survey have in the past signaled a near term official recessionary outcome. There are no exceptions to this over the history of the survey. Secondly, the confidence survey has bottomed in each economic cycle at 35 or below. The key is to wait for a reversal off the bottom before diving into the deep end of the US equity buying pool. The move in the survey back above 40 after a 35 or lower bottom in each cycle has been achieved could be considered a prudent trading tool amongst the greater analytical toolbox of life. Again, 2001 is a bit of an exception probably due to the 9/11 event.

Wonderful. We can put this one in the tool box for the next equity and economic cycle downturn. But what about now and the remainder of the current equity and economic cycle?

It turns out that trying to predict meaningful equity market and real economy contractions using the CEO business confidence data is a bit trickier, but maybe not impossible. Have a look at the following chart I’ve marked up more than a good bit.

ceobizconfidence

Let me explain. It’s not hard to understand that out of the depths of each official US recession, CEO business confidence has rocketed higher into the beginning of each economic expansion. The worst is over. Better days lie ahead. For investors as well as corporate exec’s, it’s a much happier time than what has already played out over the recent past. And in many cases we see CEO confidence run to or near all-time highs for the next economic expansion cycle early on in the cycle. Usually a year or so into the expansion cycle sees the pinnacle of CEO confidence for the entire cycle. From there on out CEOs have remained positive on the economy (above 50), but rhythmically less so as each cycle ages. In fact what is a more than apparent pattern in each economic expansion cycle is a series of “lower highs” for CEO confidence itself, ultimately leading to the next business cycle contraction. I’ve marked these clearly with the descending blue lines in each cycle.

Although we have a whopping three data points/patterns of historical experience when trying to anticipate the downside using this survey, each cycle iteration was extremely similar. As each economic/market cycle was nearing its conclusion, the prescient CEOs became a good bit more gloomy. In each cycle we saw a move to the approximate 42-43 level (the red dotted line), one last spike up in confidence that went no higher than the 50-55 range, and then the final move below 40 that signaled the expansion was over. As investors, we need to realize that these were important topping periods for equities.

Why am I bringing all of this up now? We’ve already had our move to the 42ish range for this cycle. We’ve put in the series of declining highs. In fact the most recent dip to 42 was the second time the survey hit the low 40’s in this cycle (once in 2011 and once in 2012). Are we getting a “double” due to unprecedented QE? We’re cycling back up right now based on the most recent survey numbers (1Q 2013). So, IF historical patterns and their implications for both the real economy and financial markets hold true, we need to watch these numbers like a hawk ahead. If we can break the series of declining highs to the upside, the CEOs will be telling us this already extended cycle extends further. But on the chance we see CEO confidence break back down and potentially arrive at 40 or below, I would personally consider it a very serious warning, unprecedented central banker actions or otherwise.

We’re not there yet and may never be, for all I know. The unfortunate part of the equation is that we will not again see these CEO confidence survey results until July. To be honest I believe the length between cycle results actually heightens their meaning. I told you at the outset this would be a bit of a for what it’s worth discussion. Nothing actionable right here and right now in terms of trying to make a macro call. Rather, I’m just trying to anticipate the relatively consistent rhythm of human behavior as we move into the summer months. I know real fundamentals and earnings trends have “meant less” to investors so far in 2013 relative to what has been the meaningful impact of the weight and movement of global capital. We’ve been here before. And of course the one absolute guarantee of the financial markets? Everything changes. Count on it.

MANUFACTURING SOME PERSPECTIVE

Every once in a while I find it very helpful to just sit back and look at charts that essentially have no titling. At least for myself, it’s often an easy way to “see” trends, or more importantly change in trends, without having my own personal bias of the moment get in the way of trying to interpret what the chart(s) may be telling us. Guess what? Now it’s your turn. Here you go.

charts1and2

Clearly what we are looking at above are not stock charts as we are not looking at price, but rather percentages, or more precisely percentage contributions as I’ll explain in one minute.

First, as you know, in the middle of last week we were treated to the ISM number for April. Weaker than most would have liked to have seen, but not wildly surprising given recent and obvious weakness in the Chicago and Milwaukee manufacturing numbers. The number came in at 50.7%, not too far from the mainstream vision of the “dividing line” at 50, which theoretically represents the demarcation line between economic expansions versus contraction. A reading below the current has only been seen in 4 months out of the total number of months since the current economic recovery began in the summer of 2009 (two of those came recently in November and December of last year). I will not drag you through an extensive historical retrospective, but the fact is that 50 is not the correct “economic demarcation line” number. If one goes back and looks at all the macroeconomic contractions or recessions in the US historically, ISM numbers in the mid-40’s have characterized such periods. We’ve had plenty of brushes with 50 and numbers just below without a subsequent recession over time. So to suggest that a drop to or slightly under 50 is a major recession warning is incorrect…for now.
Although many have given up on US manufacturing having watched the offshoring of so much former US manufacturing in the prior decade, the fact is that manufacturing has taken on relatively heightened importance in the current cycle for a number of reasons. Okay, Chart #1 you were looking at above is US personal consumption of “services” as a percentage of total US GDP. Remember, we export very few “services” as the bulk of services are “consumed” stateside. Very telling that US consumption of services as a percentage of GDP has been falling consistently over the 2009 to present period.

As you’ve probably guessed by now, Chart #2 is US manufacturing as a percentage of GDP. If these two charts were indeed stock charts, which is the potential buy and which is the potential sell in the current cycle? Without question the US manufacturing sector has been an important sector contributor to overall US economic health in the current cycle and it’s really no surprise as to why. Manufacturing in the US has benefitted nicely from the flood of foreign stimulus unleashed over the last five years by Asia, Europe, South America, etc. Since we do not export services, there has been no such foreign sourced benefit to the service sector.

Additionally, the US service sector has had to weather a domestic household deleveraging environment and very sluggish payroll and wage growth environment. Most probably do not realize this, but the year over year change in the US service sector (as measured by the PCE numbers) in the current cycle is the slowest over the Fed sponsored recorded history of US GDP stretching back into the late 1940’s.

pceservices

To keep myself honest more than not, the numbers above are the actual nominal numbers as opposed to the real, or inflation adjusted numbers. But even adjusting for inflation, total US service sector recovery in the current cycle has no comparison with prior cycles. Talk about not being able to achieve “escape velocity”, the US service sector in the current cycle is what that characterization is all about.

gdpservices3Q

So in one sense, the relationships you see do not speak to a dramatic US manufacturing recovery, but more of a default environment where manufacturing has done better than services as services are the anomalistic weak standout relative to historical cycles. Just why is this important? Absent meaningful US payroll and wage expansion, it’s a darn good bet the US service sector will continue to remain in tepid water at best. And that puts a big spotlight on US manufacturing looking into the back half of this year and beyond. It should be very common wisdom right now that the US will experience lackluster economic growth in 2Q and 3Q. The initial fallout from sequestration will be felt front and center during those two quarters. But very importantly, consensus thinking on the Street is that the US economy will pick up steam in the back half of the year and into 2014. Important to investment decision making, we see exactly the same pattern with consensus expected corporate earnings right now. Tepid near term growth, but a huge acceleration into the latter part of the year on into 2014. The hockey stick effect is alive and well, as is pretty much always the case anyway. Although I may not be connecting all the dots, it seems reasonable to assume that the non-services portion of the US economy will be very important to the expectation that earnings are about to rocket higher into the back half or 2013 and into 2014.

If the train of logic here is even half right, then it leaves me with a very large, and for now unanswered question. Why are cyclical stocks having such a tough time relative to defensive and consumer oriented equities? Yes, I know all about the “hunt for yield” thesis. Unfortunately, so many defensive and yield oriented equity sectors exhibit valuation metrics of the moment at multi-decade highs that forward investment risk is meaningful. Thanks, Mr. Bernanke, for forcing those who can least afford to accept investment risk (those dependent on investment income) to pay decades high top valuations to achieve very low nominal yields. If you ask me, it’s a very overcrowded trade and one that may end very badly for retail investors myopically focus on stated yields.

The following chart is a look at the Morgan Stanley cyclical stock index versus the Morgan consumer index. We’re resting at what appears quite the important juncture of the moment, now aren’t we? The actual economic numbers tell us manufacturing is important, implicitly suggesting cyclical stocks are a key watch point.

cyccmr

It is absolutely clear that on a relative basis, cyclical stocks peaked in 2011 relative to their consumer brethren, despite the fact that actual US manufacturing as a percentage of GDP has increased since then while services consumption relative to GDP has declined.

Hopefully without trying to force fit relationships, there are two other assets whose charts look a heck of a lot like the one above from 2010 to present. First, without the titles.

goldecopper

With the prices in the charts, you can guess them. Top chart is gold and the bottom copper.

I suggest to you it will be very important to monitor the health of US manufacturing ahead. A good chunk of forward consensus US corporate earnings expectations depend on it. In a forward discussion I’ll come back and look at US port statistics in an effort to further gauge the vibrancy of global trade, and by implication the health of US manufacturing. If the chart above of the Morgan cyclical versus consumer equities breaks the lows it rests upon, I suggest to you it will meaningfully call into question the hockey stick consensus US corporate earnings expectations for latter 2013 and into 2014. Oh well, I guess it’s a darn good thing the Fed has told us they may print even more money ahead. Stay tuned.

Is It Different This Time?

One of the apparent conundrums of US Fed money printing in the current cycle is lack of headline inflation, at least as measured by the CPI. Certainly the CPI calculation itself is open to debate in terms of whether it is accurately depicting the cost of living in the US. But in bigger picture context, alongside quiescent headline CPI, the US credit markets have likewise not priced in meaningfully accelerating inflationary pressures. Although the very act of currency debasement academically connotes rising inflationary pressures, the US Fed has received a free pass in the current cycle so far as prior period predictions of a hyperinflationary fireball have fallen well short of the mark.

Meaningful to global economic and financial market outcomes ahead will be the Bank of Japan monetary extravaganza of a generation that lies directly in front of us. Will Japan be so lucky as to have little to no headline inflationary impact while printing historic amounts of money? Or could it be different this time relative to the US monetary and inflationary experience of the last four to five years? Although not given much recognition amongst the high fiving over recent Japanese equity market levitation, there is one critical difference between the backdrop against which the Fed has operated compared to the landscape the BOJ faces.

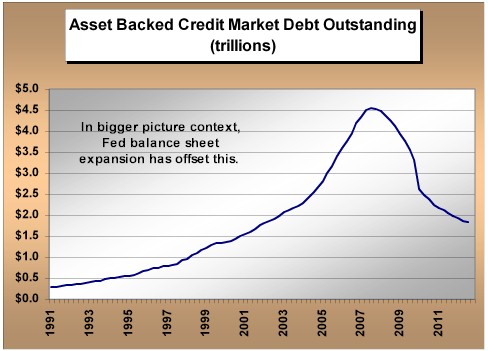
If we step back and take a bit of a bird’s eye view of the current cycle, a keynote fingerprint character point of Fed monetary policy is that it has played out in the direct aftermath of a US credit cycle bust. In terms of the timing and sequencing of potential cycles of inflation, this is important to keep in mind. In one sense what the Fed has sponsored with its own balance sheet growth has simply offset in magnitude balance sheet contraction in other sectors of the US economy, probably none more dramatic than the damage we’ve seen done to the asset backed markets over the last half decade.

assetbacked041213

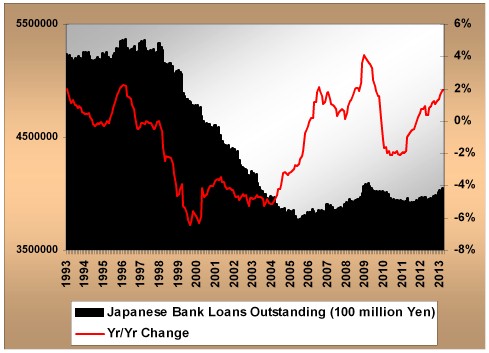
Key point being, the BOJ ahead will be operating in no such environment of immediate prior period credit contraction. The credit contraction, if you will, in Japan already occurred long ago. So if we think about Japan as a total system, BOJ money printing will be expanding the total balance sheet as there is no offsetting individual sector balance sheet contraction of consequence.

As a bit of a visual proxy, let’s have a look at Japanese bank loans outstanding since the early 1990’s. Bank loan contraction bottomed eight years ago. And as you can see, on a rate of change basis, year over year Japanese bank lending is in positive territory where it has spent precious little time if we look across a number of decades.

japanesebankloans

As of the moment, the US and Japan find themselves in different credit cycle bust aftermath time sequences. And so we should expect similar inflationary outcomes under historic monetary policy experiments? I think not. Of course the second large and differentiating factor so far is relative currency movement. We all know what has happened to the Yen over the last five months. The US dollar never experienced this type of decline anywhere over the current 2009 to present cycle. Bottom line being, we should not be surprised to see a quite different outcome with inflationary pressures in Japan than has been the recent case in the US under similar monetary extremes.

A few final comments. First, nominal inflation would really pick up in Japan if economic acceleration accompanied by meaningful wage gains were realized. This remains an open question mark on both fronts. Political leadership has advocated for higher wages in Japan, but corporate profit margins will be the ultimate determinant. On the economic front we are already seeing fallout from BOJ policy not necessarily favorable. Much as has been the case with US Fed actions for years, investors have already been trying to “front run” the BOJ. With the announcement from the BOJ targeting the lengthening of balance sheet asset maturities, investors bought long maturity JGB paper funded with sales of short maturity paper. This modestly drove down longer maturity rates, but drove shorter term yields up. Lending rates in Japan are keyed off of shorter maturity (two and five year) yield levels, so this is not a plus for lending, and by implication economic expansion. It’s more a prescription for stagflation.

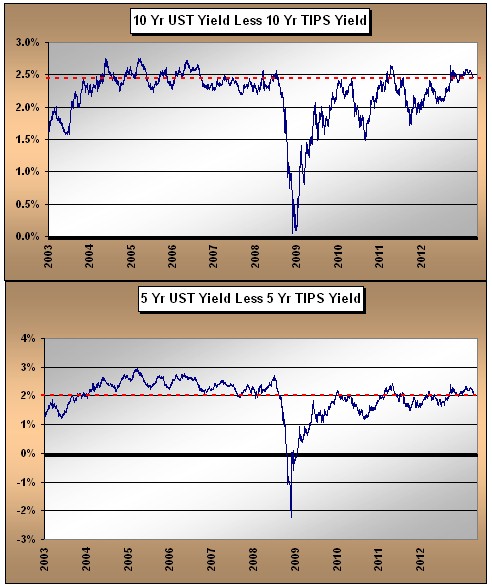
Finally, as investors we need to think about and monitor whether actions of the BOJ could transmit inflationary pressures globally, much as the actions of the US Fed have done, especially in emerging markets. We already know financial asset inflation, especially stock prices, is a key target of BOJ policy. Without question, additional Japanese capital moving out of the Yen will impact global equities. But credit markets are the key watch point as they will price in potential accelerating inflationary pressures long before equities. In the US, it’s the TIPS implied inflation breakeven rates that I continue to monitor. The US Fed began its latest round of monetary largesse at the highest implied breakeven rates of the current cycle. We’re just not that far from breaking out to “new highs” not only for the current cycle, but for the prior decade.

tipsbreakeven041213

For now, the grand monetary experiment continues. We simply need to be careful of the high level of complacency that has grown up around the impact of monetary policy on inflationary pressures in developed economies. The impact of BOJ actions will be global in nature as well as unprecedented. Stay tuned.

JAPAN: Have They Pulled It Off, Or Pulled The Pin?

We’ve seen quite the change in the Japanese stock market since the election of Prime Minister Abe last November. Accompanying the impressive stock rally we’ve seen change in the Japanese political line up with the new Abe regime and importantly, new Bank Of Japan leadership. The Japanese have now joined the global central banking chorus of “whatever it takes” (in terms of money printing to stimulate their economy). And like their global central banking brethren, they have been perceptually rewarded short term with gratuitous financial asset reflation. In one sense, what is occurring is a real game changer for Japan. Question being, a positive or somewhat darker game changer? That question remains to be answered.

What I hope is important in terms of thinking about the reality of change in Japan is looking beyond the obvious money printing anticipation and global institutional underweight driven stock levitation act of the moment. From a secular perspective, that’s short term noise. Can Japan really pull it off this time? Or will they potentially pull the proverbial pin on themselves?

Remember that this is not Shinzo Abe’s first time at bat as Japanese Prime Minister. When he first took office in September of 2006, the Nikkei rallied for five straight months, albeit not with the power or from the price depths of the current rally. The global economy at the time was also a different place with Japan’s largest trading partner China still rapidly accelerating, the US still in the midst of a real estate/credit cycle boom, and not a hint of smoke yet rising from the European periphery. Abe now embarks on his current policy adventure without the support of a global economy firing on all cylinders. Maybe this is all the more reason for what appears relatively radical monetary policy planning.

We found out the key points of BOJ policy last week from newly appointed BOJ chief Kuroda. The BOJ is targeting a 2% inflation rate within two years, a doubling of the monetary base (this is very meaningful), a doubling of JGB maturity purchases, a doubling of BOJ purchases of ETFs (equity indices) and REITs, and a commitment to a 7 trillion yen monthly purchase rate. This is clearly the most aggressive Japanese QE policy on record since 1990.
We have already seen some evidence of increased short term household spending domestically as clearly citizens are aware of potential monetary policy and currency volatility outcomes. And like experience in many other countries, financial asset levitation has been dramatic at the outset.

nikkei041613

Although late by about five days, the Nikkei hit 13,000 last week – the exact price political decision makers verbally suggested they wanted to see a month and a half back. Key technical issue being near 13,000, the Nikkei has once again encountered its 200 month moving average. The 200 month MA has been meaningful upside resistance for the secular Nikkei bear for close to 15 years now. IF we are looking at positive fundamental change for the better in Japan and the equity market is correctly anticipating such an outcome, that key technical demarcation line needs to be taken out decisively to the upside. It’s probably the spot where we get a bit of volatility and testing short term.

But as we all know, the transmission mechanism of monetary policy into real economies in the global economic environment of the moment has been problematic up to this point. Central bankers have shown us they know how to reflate the price of financial and in some cases hard assets. But their fundamental impact on real economic activity and direction unfortunately still leaves a whole lot to be desired. For now, the difference for Japan singularly is an apparent strong commitment on the part of the BOJ to remain aggressive, unlike prior BOJ monetary policy excursions. So what do we look for in Japan in terms of trying to gauge whether Abe and BOJ monetary policy plans will positively impact the secular trend of the Japanese economy? Can they really pull it off this time?

Again, the lesson of the last four years appears clear. Monetary policy can move the asset price needle for a time, but has had much less impact on the fundamental reality of individual economies. Why has this been the case? Although it’s just my personal opinion, if we look at the experience of Europe and the US just what has been lacking? Reform. Europe has thrown pieces of money at hotly burning short term financial/economic/banking system fires mostly in peripheral countries, but has done absolutely zero to reform the key infrastructure of the Euro system itself. In like manner, the US has done nothing to reform the TBTF financial sector 800 pound gorilla’s as their ever expanding girth remains a key systemic issue. Reform of debt, deficit and entitlements at the government level stateside? The sequestration is lip service compared to what is actually needed and will ultimately be accomplished one way or the other. Key issues of reform avoided….for now. Is this the reason why achieving economic “escape velocity” has been so elusive?

So as we look at Japan I would suggest to you that beyond money printing and the global institutional investment underweight in Japanese equities impacting current price, real fundamental economic change in Japan will come with reform and deregulation. This is what would turn a momentum rally into perhaps the beginnings of a longer term bull market. Money printing can certainly gin up stock prices, but sustained economic change must be driven by reform. This is where the Abe rubber will meet the road.

Although this is an incredibly short and certainly incomplete list, what needs to be done? Corporate tax reform. The stimulation of business fixed investment. True change in constricting labor rules and regulations (is there an echo in here from France?). The opening of markets to foreign investment and competition. Reform in immigration policy as Japan’s demographic issues still loom large. The rally in the Nikkei up to this point has certainly been fun, but attacking and successfully navigating these issues of needed fundamental economic reform will not be accomplished in such linear fashion. There will be bumps in the road, as is the case in any environment of true fundamental change.

In addition to fundamental economic reform, the Japanese corporate sector must also act to become more shareholder oriented in terms of capital allocation. The quality and action of corporate governance is key here. M&A focused at least in part on productivity, share buybacks and increased dividends would all play a part at the margin in a potential rerating of Japanese equities relative to global equity valuation metrics.

Does Japan have the potential to break the chains of its multi-decade economic malaise? Indeed it does, as do its developed economy brethren. True fundamental economic reform is the key. The political will to print money is an easy one, but the heavy lifting of true economic reform is another story all together, exactly as we’ve witnessed in the US and Europe so far into the current cycle.

The risk, of course, for Japan, is monetary debasement in the absence of true fundamental reform. We’ve seen the Yen weaken meaningfully since last October and that has clearly sent Yen based capital in motion globally. We’ve seen a very meaningful increase in short term JGB price volatility, as witnessed relatively dramatically last week. In the absence of true reform, I suspect we’ve only seen the beginnings of Yen based capital flight globally, which of course has ramifications for global asset markets. There is no question in my mind that Abe and the BOJ are not acting in isolation. They’ve clearly received the blessing of the US. Remember the swaps Bernanke arranged for the Euro community a few years back? You can bet there are a few tricks up central banker sleeves to attempt to quell any type of market dislocations ahead. But again, coordinated central bank actions can really only influence the short term. The long term is all about the reflection of fundamental reality. In one sense, stop watching the Nikkei and start watching for real change and reform in Japanese domestic economic policy, none of which was discussed by the BOJ last week.

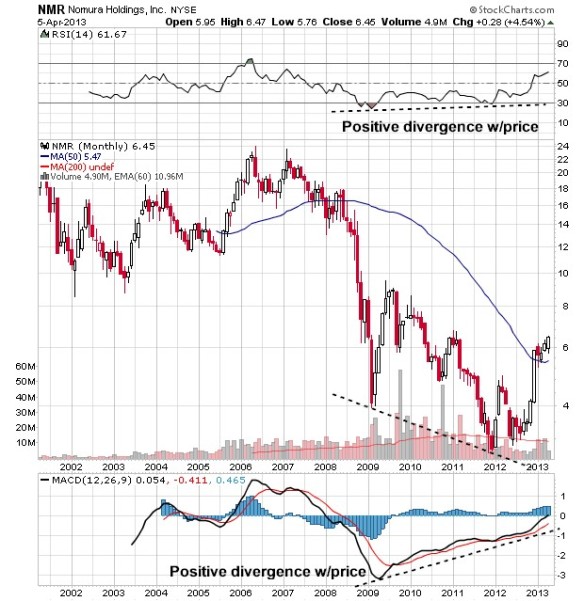
I’ll leave you with one last and perhaps too simplistic thought. Historically, true equity bull markets correctly anticipating economic cycle acceleration have often been led by financial stocks. That’s one thing that has not been seen in the US and Europe over the current cycle, of course suggesting the underpinnings of the cycle are unlike historical experience. In Japan, two lead financial sector sled dogs are Nomura and Mitsubishi Financial, whose charts are seen below. Interestingly, we see a positive divergence on the monthly charts between price action and both the RSI and MACD measures over the entire 2009 to present cycle. Admittedly we saw this same technical set up for Mitsubishi in the early part of the last decade. They have certainly dutifully rallied along with the Nikkei, but if we are even close to seeing the beginnings of true secular change in Japan that necessarily must be accompanied by real reform, these two are just getting started. Stay tuned.

mitsubishi

nomura

“FIXING” THE PAYROLL PROBLEM

With the US Fed’s third quantitative easing program since 2009 announced in latter 2012, QE3, we know the Fed is explicitly targeting two key hoped for outcomes. First, Mr. Bernanke has told us he wants to see higher stock prices. So far, so good. The thinking being that if stock prices rise, households will “feel” wealthier and be motivated to increase their consumption – the so-called “wealth effect”. Secondly, Mr. Bernanke tells us that the Fed intends to keep interest rates at zero and will continue to print money (at a current annual rate equal to 6.5% of GDP, well above actual GDP growth) until the US unemployment rate at least reaches 6.5%. But are these two key Federal Reserve endpoint goals actually at odds with each other? I do not see this question being asked, but believe it is very deserving of consideration. Could it really be that the Fed’s own worst enemy in this grand and unprecedented monetary experiment is…the Fed itself? And if indeed the Fed may in part be working against itself, what does that mean for the markets and economy?

Let’s start with some backdrop. In the past I have written about my own perception that in the current environment the “wealth effect” is an academic fallacy. At the heart of the Fed’s wealth effect assumption is that households will have something to spend. Wage growth in the current economic cycle has been tepid, to be charitable, so growth in wages will not be meaningful fuel for additional consumption at the margin. If stock and real estate prices rise, as the Fed wishes, again, what will households spend? Will they sell their stocks and real estate, and use the proceeds for short term consumption?

From the early 1980’s to the middle part of the last decade, the US savings rate dropped from a high of 12% to a low of 1%. Over that period where stock and real estate prices ascended in generational fashion, households spent down their savings – that was the wealth effect in action. Bottom line being, the precursor of a positive wealth effect is a substantial household savings rate. In the current cycle, households have not been able to rebuild their savings due primarily to ongoing deleveraging and lack of wage growth. The character and magnitude of household savings are key not only to the Fed’s desired wealth effect (a primary rationale for QE), but also play an important secondary role in the broad economy that ultimately impacts payroll employment (the latest Fed target rationale for QE3).

If you’ll bear with me for a minute, let’s review the academic definition of GDP. Although perhaps painful, you may remember that in your Econ 101 class of yesteryear, GDP, or output, was defined as the sum of consumption, Government spending and investment (simplistically this definition ignores imports and exports). Whatever is not consumed by households or the Government is available as savings, or investment. It’s in this basic equation that we see the importance of savings as the fuel for future investment in productive economic assets. Now to the potential conundrum in Fed policy of the moment.

One fingerprint character point of the current economic cycle has been the unprecedented weakness in business fixed investment. Very important in that investment in productive capacity (think manufacturing plant and equipment) provides any economy a basis for future growth in trade, and by definition jobs. What could be more important in the increasingly globalized and competitive economy of the present? It’s not wildly surprising in that businesses invest when they foresee expansion in aggregate demand. We know this has been a very slow growth environment.

The top portion of the chart below shows us the history of US business fixed investment as a percentage of GDP. Experience in the current cycle reveals the lowest non-recessionary level on record. And in the current economic cycle, this has been accompanied by some of the lowest historical US savings rate levels ever seen. As your economics teacher would remind you, savings equals investment.

savingsfixedinvest

One more important historical economic data point correlation that ties the importance of business fixed investment to payroll growth. The chart below shows us the year over year change in US business fixed investment alongside the annual change in US payrolls. The key observation is that historically, the year over year change in fixed investment has led the year over year change in US payroll growth in each economic cycle of the last half century. As stated above, fixed investment is the cornerstone of longer term growth in productive capacity and jobs.

             fixedinvestemploy

So back to the original question – is current Fed policy focused on both the wealth effect (the stock market) and lower unemployment competing agendas? IF the Fed is successful in sparking a wealth effect via higher stock prices, already low US savings will be further drawn down for consumption. But as per the very academic definition of GDP, increased savings are crucial for the expansion of business fixed investment. Importantly, we know from the historical chart above that increased US business fixed investment is directly tied to US payroll expansion. Increased savings equals increased investment, which in turn increases job growth.
So for the Fed to see a lower unemployment rate, it makes sense that US savings (and investment) need to rise. But if US savings rise, it will be at the expense of present consumption, negating the supposed positive wealth effect of driving stock prices higher. At least to me, it’s a very confusing Federal Reserve agenda. I have heard Mr. Bernanke give many a speech espousing the benefits of money printing in terms of levitating stock and real estate prices. But I’m still waiting for a speech that has never been given. A speech that directly links the Fed’s money printing and purchasing of US Treasuries and mortgage backed securities to actual job creation. I would think for an academician such as Mr. Bernanke and many of his Federal Reserve cohorts, there must at least be an equation similar to the exercise I walked through above regarding such a linkage between Fed bond buying and jobs, shouldn’t there? I guess for now it’s a secret.
Current business fixed investment remains subdued in terms of growth. That tells us payroll growth will come, but it will be slow. Not surprising within the context of a still relatively slow growth economy compared to historical experience. Near term, Fed money printing will continue to support asset price reflation. In the absence of accelerating fixed investment, corporate cash flows are being used for dividend increases and stock buybacks, likewise acting to underpin stock prices. Given this set of circumstances, we do have an environment where financial assets prices may diverge from underlying macroeconomic fundamentals. It’s into such divergence potential where risk management in the investment process takes on heightened importance.

The Great Rotation Or “Greater Fuel Theory”?

One of the rationale’s we’ve heard from time to time for market bullishness since we were babes-in-the-wood investors is the “mountain of money” argument. “Cash on the sidelines”, as it’s also known. We’ve heard it at major market peaks and major market troughs. It’s convenient, it sounds good and every once in a while may even be true. But there are so many economic dynamics affecting cash holdings and how invested positions are analyzed, that no one macro argument dominates one way or the other.

A new concept chant for 2013 on Wall Street is what has been called “The Great Rotation”. The argument runs that money is finally leaving the bubble that is bonds and is and will continue to find its way increasingly into equities. Now before venturing even one step further into this discussion, let us be clear. Starting from where we stand today and looking over the truly longer term (say 5-10 years), the mathematics of bonds leave a good deal to be desired. Personally, we think bond “mathematics” border on scary looking over the long term, especially set against ongoing Fed balance sheet and US Federal debt expansion. Alternatively, the mathematics of equities argues more positively for stock investment on a relative basis for anyone with even a modicum of time, patience, and a tolerance for short term price risk. Having said this, we want to look at a few metrics that suggest it may be a bit too early to argue the stampede is on in terms of this so-called “great rotation” from bonds to stocks that has gone mainstream as of late. We’ll get there eventually, and who knows, maybe in the not too distant future. But the starting gun has not gone off yet, despite what you might hear on the “news”.

To set the stage, since 2009 equity mutual funds have been under consistent selling pressure. The common thinking is that the public has been liquidating their equity mutual fund holdings as stock prices have moved higher. In like manner, investment inflows into US bond mutual funds have registered record numbers, giving rise to the thinking that the general public has moved to bond investments en masse after experiencing two gut wrenching 50% stock bear markets in less than a decade’s time from 2000-2009. The reason for the “new new thing” mantra? Well, inflows to US equity funds so far in 2013 have been of a magnitude not seen in years.
Let’s go to the metrics. Investment flows into equity mutual funds so far this year have seen a dramatic turnaround relative to comparable year-to-date inflows from 2012. But what seems left out of the discussion at present is the like period YTD flows into bond funds. The following chart documents YTD flows for both 2013 and 2012 into US equity funds and ETFs (Exchange Traded Funds) on a combined basis as well as collective investment flows to US bond funds and ETFs.

funds

If we consider flows into US equity mutual funds and equity ETFs on a YTD basis, we’re looking at a 135% increase in 2013 numbers relative to last year. Impressive, right? Yet when looking at the combined US bond mutual fund and US bond ETF flows, the year over year increase we’re looking at totals a paltry 2% increase. Put differently, YTD 2013 flows into US bond funds and ETFs are 61% larger than flows into US equity funds and ETFs as of mid-February. So the question becomes clear as per the data – where is the great rotation from bonds to stocks? Yes, equity funds are receiving greater investment inflows year over year in absolute terms, but flows into US bond funds YTD remain larger than into equities, and haven’t subsided. An inconvenient fact left out of a lot of recent “analysis”? It sure appears so.

Again, the current “mathematics” of bond investment doesn’t make a lot sense when looking out over any reasonable time frame. But, we need to remember that in the very near term flows we are seeing into equity mutual funds today are in large part driven by tax anticipation behavior we saw in Q4 of last year and specifically in December. In very interesting behavior, YTD 2013 flows into US equity ETFs are actually down substantially relative to 2012 YTD experience. Odd in that US equity ETFs have been attracting positive flows at the expense of US equity mutual funds for years now. Why would this switch be happening? Again, it may have roots in Q4 2012 and December ‘12 events.

Remember that in Q4 2012 and December specifically we experienced a massive anomaly in accelerated dividend payments by many corporations. From Las Vegas Sands to Costco and well beyond, billions were paid out to equity investors in “special” common stock dividends, and of course a portion of this clearly floated through equity mutual funds winding up as money market fund cash in mutual fund accounts. As we move into 2013, are we simply seeing this money return to its rightful home in equities and equity funds, exactly where it was invested a few months ago? We think so. Combine this with 2012 end of year bonuses, earned income accelerated into 2012 to beat the taxman, early year qualified plan contributions, etc. and all of a sudden the newfound resurgence of money flows to equity funds looks a lot more explainable. Moreover, the very numbers themselves do not show bond fund/ETF liquidations – quite the opposite. So, this great rotation from bonds to stocks may come to be, but it has not started yet.

Tangentially related to current period “analysis” and this great rotation thinking (which we would suggest has been less than thoughtful or thorough), is commentary regarding the positioning of large institutional pools of capital. It was a month back that we saw an article in Barron’s proclaiming large pension funds to be only 34% invested in stocks. We saw a similar number thrown out by a fund manager in Barron’s again just a few weeks ago. Of course the implication is that 65% of institutional pension assets are invested in bonds. Nothing could be further from the truth, but it sounds good in printed media and on TV, right?
Just where are these numbers coming from? Luckily, you can find them quite conveniently in the quarterly Fed Flow of Funds report published on the Fed’s own website. So let’s have a look at the raw data and see if perhaps there are a few “unanswered” questions these analysts have forgotten to include in their commentaries. Below is the current asset class breakdown of US Private (think corporate) Pension Fund investments.

Private Pension Fund Total Assets (billions) $ 6,598.7 % Of Total Assets

Cash (Money Fund) 226.4 3.4 %
Credit Market Instruments 1,166.4 17.7
Equities 2,254.4 34.2
Mutual Funds 2,370.0 35.9
Unallocated Insurance Contracts 491.0 7.4
Other (misc) 90.4 1.4

As you can see, right there is that 34.2% allocation to stocks, exactly as these commentators have described. Private pension fund bond holdings are broken out in detail under “credit market instruments”. The numbers further are broken down explicitly among Treasuries, corporate bonds, Mortgage Backed Securities and Government agency bond holdings. This apparent low allocation to equities actually has been consistent for over a decade now. It did not all of a sudden drop post 2008. The real issue being that the Fed Flow of Funds report does not delineate just what is inside the “mutual funds” categorization. The superficial analysis you have been treated to as of late implies/assumes it’s in bonds, just waiting to “rotate” into stocks.

Let’s remember that private pension funds have been much more aggressive than their public pension fund counterparts over the decades as they shifted allocations to “alternative investments” (e.g. private equity, commercial real estate, venture capital, etc.). Moreover, private pension funds pay well below bond mutual fund fees to have their individual bond allocations managed, so they wouldn’t have a large investment allocation to bond mutual funds. The quoted analysts touting this great rotation thesis have been using selective statistics.

While not broken out, private pension funds have been and continue to be heavily invested in private equity “funds”, hedge “funds”, commodity “funds” and institutional commercial real estate “funds”, among a number of other alternative asset class categories. In large part, is this what we are looking at in this category of pension fund mutual fund holdings? Of course it is. Are these really the type of assets just waiting to “rotate into stocks”? Of course not. In many senses they are already there. So it’s obvious where the superficial analysis of the moment breaks down, despite that “rotation” story and those institutional asset allocation stats appearing in headlines and sound bites. As Steven Colbert would suggest, it’s analytical truthiness. It sounds like the truth. It could be the truth. But…..it’s not the truth.

Before wrapping up, let’s look at Public Pension fund (think States and municipalities) asset allocations. You will not see the aforementioned analysts quoting these numbers. Why? Because they show the Public Pension funds are already 61% invested in equities. That also does not support the great rotation thesis.

Public Pension Fund Assets (billions) $ 3,093.0 % Of Total Assets

Cash (MMF) 59.4 1.9 %
Credit Market Instruments 850.2 27.5
Equities 1,890.3 61.1
Mutual Funds 274.6 8.9
Misc 18.5 0.6

The numbers tell the story. And of course public pension fund assets are also exposed to alternative investments such as private equity, hedge fund, commercial real estate, commodity, etc., just to a lesser extent than their private pension fund brethren. The public and private pension assets in the US “rotated” a long time ago.

So there you have it – just a few facts to contemplate amidst the cacophony of daily “noise” that is often financial market commentary. As always, we have to look under the hood in financial market and economic analysis. In summary, as our President would say, let me be clear. Current bond investment mathematics border on scary if you buy today and look long term. Equities have a relative advantage in a world where central bankers have eliminated the return component from principal safe investments. Central bankers having flooded the global system with unprecedented conjured liquidity that could easily spark an equity “melt up”. We remember an analyst we respect saying a few years back that the public will not come back to equities until they make a new high. We concur. The public always chases the inflating asset….until it stops inflating, of course. Remember the old Wall Street adage – never confuse brains with a bull market. And here’s a new one for you – never confuse asset class rotation stories with central bank asset reflation (one of the Fed’s primary goals of quantitative easing is to get stock and real estate prices higher).
Can we characterize our current circumstances as the “The Greater Fuel Theory”? Time will tell.

Will QE Affect The Effect?

When global central banks began to expand their balance sheets in an attempt to ward off the Great Recession of 2008-2009, their efforts were unprecedented. Never before had we seen so much money creation occur simultaneously on a global basis. At the time, planned central bank quantitative easings (printing money) were well defined in terms of time over which they would occur and magnitude of dollars/foreign currency involved in each QE iteration.

That was then. Despite significant global government borrowing (US Federal debt alone has doubled since 2006) and global central banks printing over $11 trillion since 2008, global economic growth is tepid. In fact, this unprecedented global government borrowing over the last four years has necessitated tax increases in many countries, including the US. The US has sold this as a tax on the wealthy. But when looking at the reality of US Government budget and forward spending projections, there is absolutely no way our federal government can fund its current spending and promises trajectory without very meaningful middle class tax increases to come. Shhh!!! The politicians just have not told anyone yet.

As a bit of a bookend to global central bank balance sheet expansions, we’ve now come 180 degrees from where we were in early 2009. No longer are central bank quantitative easings defined either in terms of time or magnitude – several central banks have recently promised unlimited money printing over an indefinite period of time.

This is exactly what the US Federal Reserve continues to say and do four years into our current economic recovery. The election of Abe in Japan a month ago cements the fact that the Bank of Japan will join in unlimited money printing. The Bank of England is on the cusp of another round of money stimulus. And despite the recent appearance of calm in Europe, banking system recapitalization has not even begun – it will be quite the eye opener in terms of European Central Bank balance sheet expansion to come. Four years after the Great Recession reportedly ended, global central bank actions are pushing the definitional limit of “unprecedented”.

So what has been accomplished by central banks in their historically unprecedented monetary experiment, if not achieving acceleration in economic growth? Well, the nominal level of interest rates rests at generational lows. By pushing interest rates to rock bottom, central banks have raised the net present value of alternative streams of cash flow. In other words, they have been successful at inflating certain asset prices that might not otherwise have risen to their current heights. The US Fed has told us without flinching that they have been directly targeting stock and residential real estate prices. Why? The Federal Reserve believes in what has been termed the “wealth effect”. The thinking goes like this. If asset prices rise, consumers will feel more “wealthy” and will consume at a higher level than would otherwise have been the case. Additionally, consumers might even feel well off enough to borrow and spend if the value of their houses and portfolios rise, exactly as happened during the housing boom of the prior decade. The fact that consumption drives roughly two-thirds of US GDP has certainly not been lost in Fed thinking and actions.

Now that we have embarked on perhaps the final phase of unlimited and indefinite global central bank money printing, will this quantitative easing finally, positively affect the “wealth effect”? Will boundless and limitless promises of money printing do the trick in getting US and global consumers to finally borrow and spend? So far, rising home prices for the last year and rising stock prices for the last four have yet to be the tonic for accelerating domestic consumption. Over the 2007 to early 2009 period, consumer net worth in the US contracted close to $12 trillion. If stock and home prices continue on their current price trajectory, all of this contraction in household net worth will have been recovered sometime this year. Households should be feeling great, correct? So, will it work?

Well, that remains to be seen. Moreover, we question the ability of central bankers to positively affect the so-called household wealth effect (and by implication consumption) by simply printing unlimited amounts of money to levitate residential real estate and equity prices. Why is this the case? Let’s have a look back at some data history I believe is quite important in contemplating this question. For not only does it have bearing on forward potential economic strength, but speaks to where stock and residential real estate prices may head for a time. The graphs below display the US savings rate and the S&P 500 since 1980. The large rise in stock prices from 1980 to present is clear. Intuitively, we also know that over this same period residential real estate prices increased significantly, despite the downturn of the last half decade. Neither of these phenomena should be surprising, as the 1980 to present time frame mimics the coming of age and maturation of the baby boom generation – a generation that bought homes and started retirement plan savings en masse over this period.

What’s important in the relationship comparative graph below is that over the 1980 to roughly 2006 period, the US savings rate declined from 12% to what was a record low near 1%. This occurred while stocks and residential real estate experienced a generational bull market. So let’s step back and think about the concept of a wealth effect – key to current central bank actions. Remember the Fed’s logic reads that if households “feel” wealthier based on rising stock and house prices, they will go out and spend/consume. But this line of reasoning seems to truncate without addressing the key economic question of “spend what?” If stock prices rise, will households sell them and use the proceeds to buy consumer goods? If housing prices advance smartly, will households sell their homes and rent, using the proceeds from the home sale to fund short term consumption? These questions are exactly why the relationship you see below is so important. Over the 1980 – mid-2000’s period, as household “wealth” increased via higher stock and residential real estate prices, it is absolutely clear that households “spent” their savings to consume at a higher level than would have been the case otherwise. We also know households borrowed to consume (remember HELOC loans?)

.savingtsspx


What this historical relationship implies is that for the “wealth effect” to be a positive economic force that spurs consumption, households must have something other than stocks or real estate assets to liquidate and use for consumption, exactly as they did from 1980-2006. They either need to spend their savings or borrow to consume. The key issue of the moment is that at least in the US, savings have not been rebuilt post the Great Recession. As of now, there are no increased savings to spend down while the Fed attempts to make households feel better via their efforts to levitate residential real estate and equity prices. The household savings rate today stands just shy of where it stood in January 2008. I’d again ask the question “spend what?” In the post Great Recession environment, the largest growth in consumer credit has been in student loans, not in revolving or non-revolving credit balances. Households hurt by heavy debt balances, largely related to real estate investments from the prior cycle, have not embarked on a new borrowing cycle. From my vantage point, QE will not positively affect the “wealth effect” and translate into accelerating consumption and domestic GDP growth directly because of the lack of domestic savings, and households remaining gun shy about leverage.

So where does this leave us? It still leaves us with global central bankers committed to unlimited and indefinite money printing, but also a persistent ongoing disconnect between the printing of money and actually getting that money into the real economies globally, as has been the case since 2009. The money they “create” still needs to find a home. And now that we’ve moved into unlimited money printing mode, that means one big home. As a rule, central bankers can create additional liquidity, but they cannot control where or how that money will be put to use. Ideally, they would like to see banks increase lending with this unprecedented liquidity and theoretically get that money into the real economy, but bank lending has been very slow.

Almost as default, that leaves the global financial and commodity markets as a potential repository for historic global central banker largesse. Over the past four years we have heard more than a number of commentators tell us that “the stock market is doing well so the economy must be doing well”. Unfortunately this has not proven to be the case as we continue with one of the most anemic economic recoveries on record. Although we are certainly not there yet, the danger is that this current round of extraordinary excess central banker liquidity creates further asset bubbles, very much as happened with the late 1990’s tech stock bubble and the clear bubble in mortgage lending in the middle of the last decade. By the Fed’s own admission, they missed “seeing” the last two asset bubbles they had a hand in creating. Now that we have moved into the endgame of global central bank monetary expansion, let’s hope central bankers everywhere have had their annual optometrist check-up.